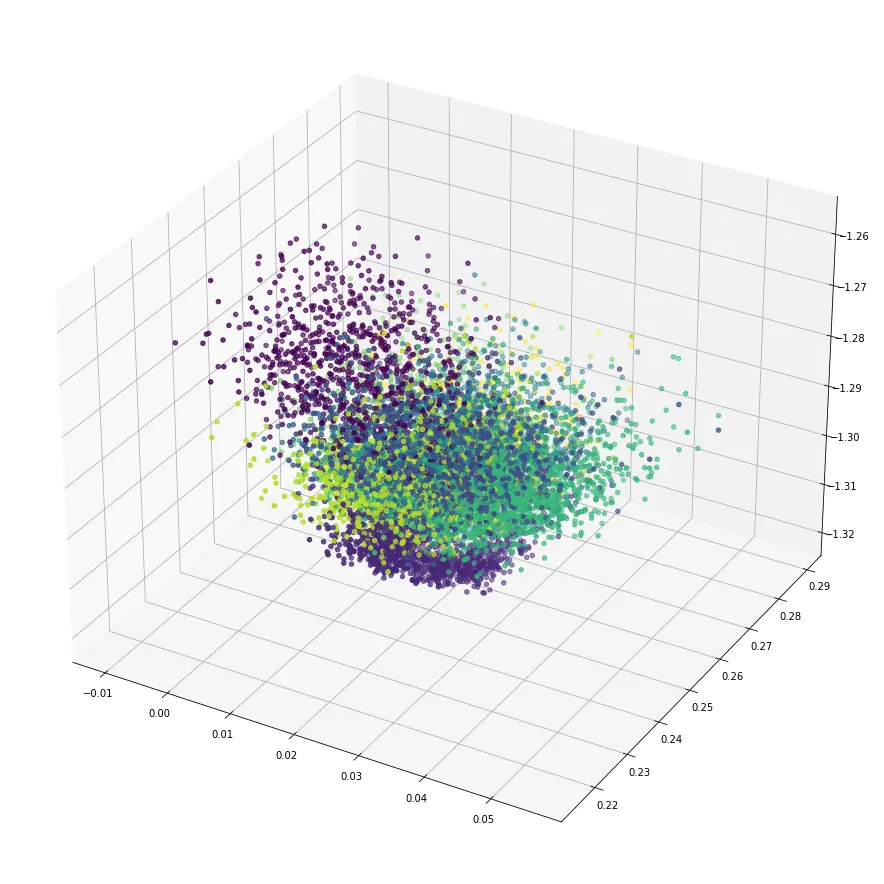
Visualising the latent space of a latent variable model (such as a VAE) is often part of the process in learning about how these model work and ultimately how we can then use the model to generate new data. Here is the 3D latent space of a simple VAE visualised using MatplotLib:

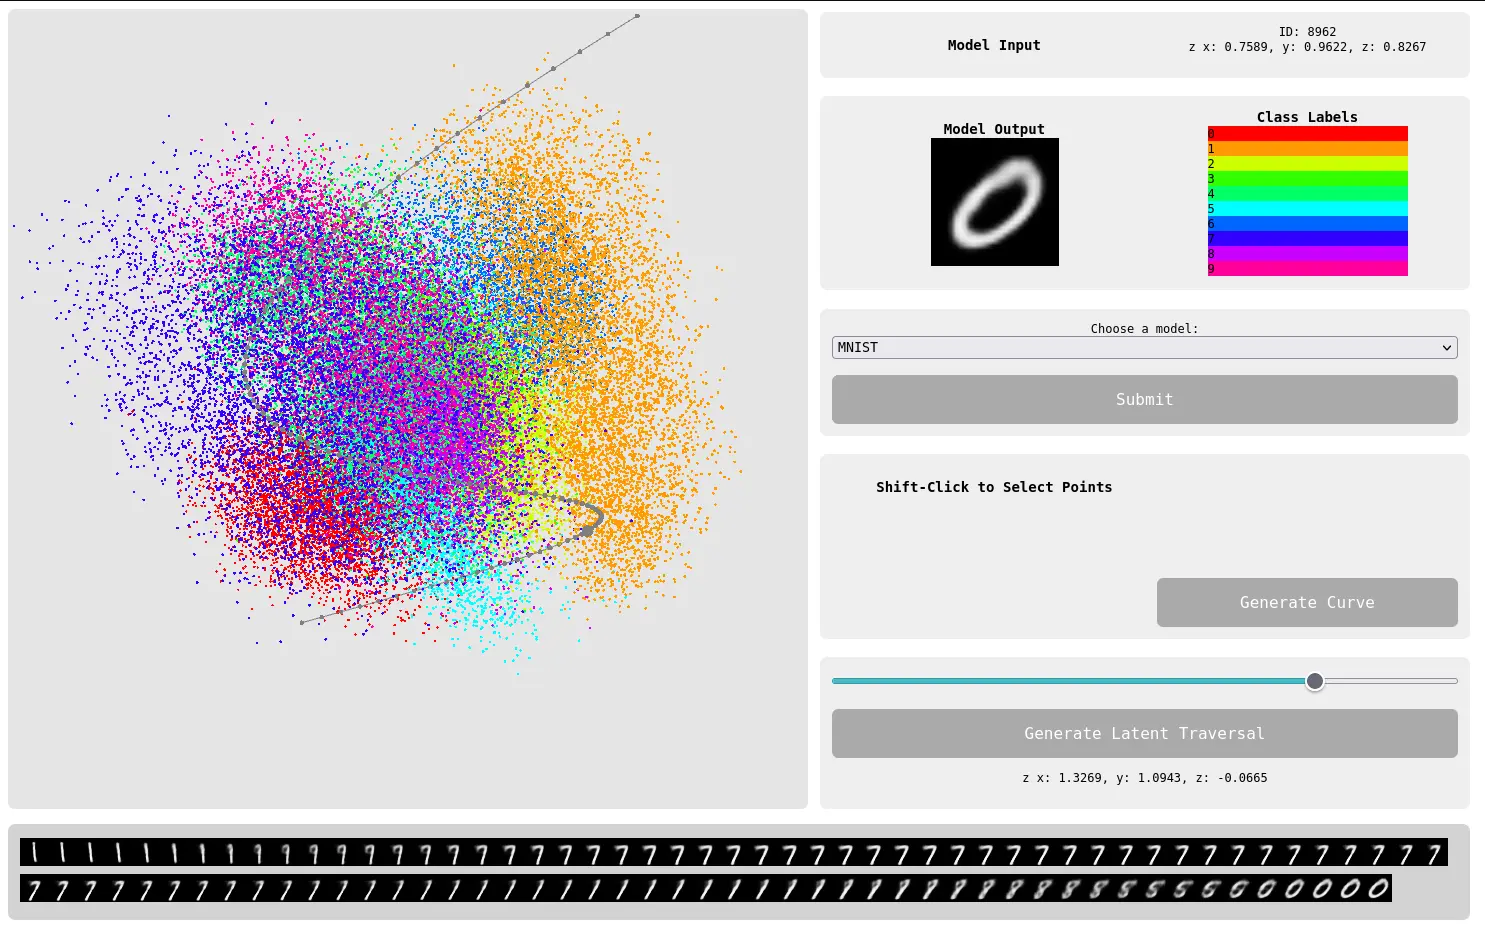
This project an attempt to make the 3D scatterplot of the latent space interactive. Generating an image by traversing the latent space of some kind of encoding latent space model is a right-of-passage for any generative machine learning student. Grasping the concept of what the latent space is is always a challenge. Grasping the concept of highly dimensional data is a tricky concept in itself. So this tool is something which makes that space more literal, and allows you to draw a line through that space and generate a series of images based on that traversal through space.

